
Supermarket Sales Dashboard
Overview
The purpose of this project was to develop a centralized and interactive Power BI dashboard that visualizes supermarket performance across various dimensions—sales trends, customer demographics, product line analysis, payment preferences, and operational efficiency. The dashboard aims to empower managers with real-time, self-service analytics for strategic and operational decision-making.
Tools Used
Power BI
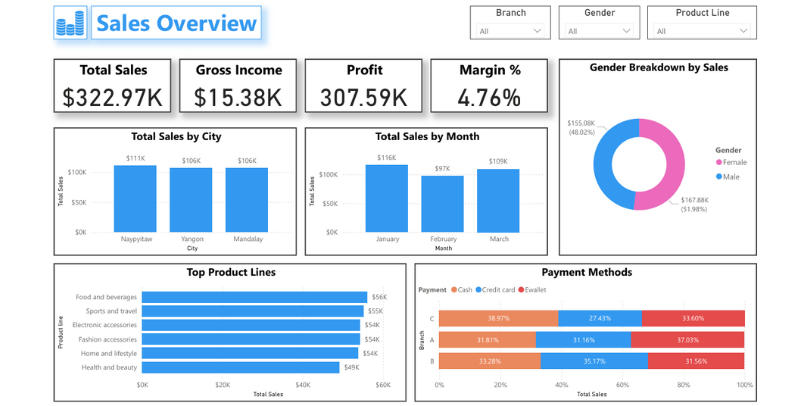
This report details the development of a Supermarket Sales Performance Dashboard using Power BI. The solution integrates static transactional data into a highly visual, interactive tool for business users. By leveraging DAX, Power Query, and advanced visuals, the dashboard provides deep insights into revenue drivers, customer behavior, and operational performance across all branches. The final deliverable supports data exploration, performance monitoring, and decision-making in real time. The solution helps executives and branch managers make smarter, faster decisions.
The Supermarket Sales Performance Dashboard developed using Power BI has proven to be an invaluable tool in helping the client turn raw transactional data into meaningful and actionable insights. Through an intuitive interface, modular design, and advanced interactivity, the dashboard has transformed the client’s approach to performance monitoring, strategic planning, and daily operations.